Monitor all the things! ... and early too!
Following the "release often, release early" mantra, I thought it might be a good idea to apply it to monitoring on one of our client projects. So right from the demo stage where we deliver a new version every few weeks (and sometimes every few days), we setup some monitoring.

Monitoring performance
The project is an application built with the CubicWeb platform, with some ElasticSearch for indexing and searching. As with any complex stack, there are a great number of places where one could monitor performance metrics.

Here are a few things we have decided to monitor, and with what tools.
Monitoring CubicWeb
To monitor our running Python code, we have decided to use statsd, since it is already built into CubicWeb's core. Out of the box, you can configure a statsd server address in your all-in-one.conf configuration. That will send out some timing statistics about some core functions.
The statsd server (there a numerous implementations, we use a simple one : python-pystatsd) gets the raw metrics and outputs them to carbon which stores the time series data in whisper files (which can be swapped out for a different technology if need be).

If we are curious about a particular function or view that might be taking too long to generate or slow down the user experience, we can just add the @statsd_timeit decorator there. Done. It's monitored.
statsd monitoring is a fire-and-forget UDP type of monitoring, it should not have any impact on the performance of what you are monitoring.
Monitoring Apache
Simply enough we re-use the statsd approach by plugging in an apache module to time the HTTP responses sent back by apache. With nginx and varnish, this is also really easy.

One of the nice things about this part is that we can then get graphs of errors since we will differentiate OK 200 type codes from 500 type codes (HTTP codes).
Monitoring ElasticSearch
ElasticSearch comes with some metrics in GET /_stats endpoint, the same goes for individual nodes, individual indices and even at cluster level. Some popular tools can be installed through the ElasticSearch plugin system or with Kibana (plugin system there too).
We decided on a different approach that fitted well with our other tools (and demonstrates their flexibility!) : pull stats out of ElasticSearch with SaltStack, push them to Carbon, pull them out with Graphite and display them in Grafana (next to our other metrics).

On the SaltStack side, we wrote a two line execution module (elasticsearch.py)
import requests
def stats():
return request.get('http://localhost:9200/_stats').json()
This gets shipped using the custom execution modules mechanism (_modules and saltutils.sync_modules), and is executed every minute (or less) in the salt scheduler. The resulting dictionary is fed to the carbon returner that is configured to talk to a carbon server somewhere nearby.
# salt demohost elasticsearch.stats
[snip]
{ "indextime_inmillis" : 30,
[snip]
Monitoring web metrics
To evaluate parts of the performance of a web page we can look at some metrics such as the number of assets the browser will need to download, the size of the assets (js, css, images, etc) and even things such as the number of subdomains used to deliver assets. You can take a look at such metrics in most developer tools available in the browser, but we want to graph this over time. A nice tool for this is sitespeed.io (written in javascript with phantomjs). Out of the box, it has a graphite outputter so we just have to add --graphiteHost FQDN. sitespeed.io even recommends using grafana to visualize the results and publishes some example dashboards that can be adapted to your needs.

The sitespeed.io command is configured and run by salt using pillars and its scheduler.
We will have to take a look at using their jenkins plugin with our jenkins continuous integration instance.
Monitoring crashes / errors / bugs
Applications will have bugs (in particular when released often to get a client to validate some design choices early). Level 0 is having your client calling you up saying the application has crashed. The next level is watching some log somewhere to see those errors pop up. The next level is centralised logs on which you can monitor the numerous pieces of your application (rsyslog over UDP helps here, graylog might be a good solution for visualisation).

When it starts getting useful and usable is when your bugs get reported with some rich context. That's when using sentry gets in. It's free software developed on github (although the website does not really show that) and it is written in python, so it was a good match for our culture. And it is pretty awesome too.
We plug sentry into our WSGI pipeline (thanks to cubicweb-pyramid) by installing and configuring the sentry cube : cubicweb-sentry. This will catch rich context bugs and provide us with vital information about what the user was doing when the crash occured.
This also helps sharing bug information within a team.
The sentry cube reports on errors being raised when using the web application, but can also catch some errors when running some maintenance or import commands (ccplugins in CubicWeb). In this particular case, a lot of importing is being done and Sentry can detect and help us triage the import errors with context on which files are failing.
Monitoring usage / client side
This part is a bit neglected for the moment. Client side we can use Javascript to monitor usage. Some basic metrics can come from piwik which is usually used for audience statistics. To get more precise statistics we've been told Boomerang has an interesting approach, enabling a closer look at how fast a page was displayed client side, how much time was spend on DNS, etc.
On the client side, we're also looking at two features of the Sentry project : the raven-js client which reports Javascript errors directly from the browser to the Sentry server, and the user feedback form which captures some context when something goes wrong or a user/client wants to report that something should be changed on a given page.
Load testing - coverage
To wrap up, we also often generate traffic to catch some bugs and performance metrics automatically :
- wget --mirror $URL
- linkchecker $URL
- for $search_term in cat corpus; do wget URL/$search_term ; done
- wapiti $URL --scope page
- nikto $URL
Then watch the graphs and the errors in Sentry... Fix them. Restart.
Graphing it in Grafana
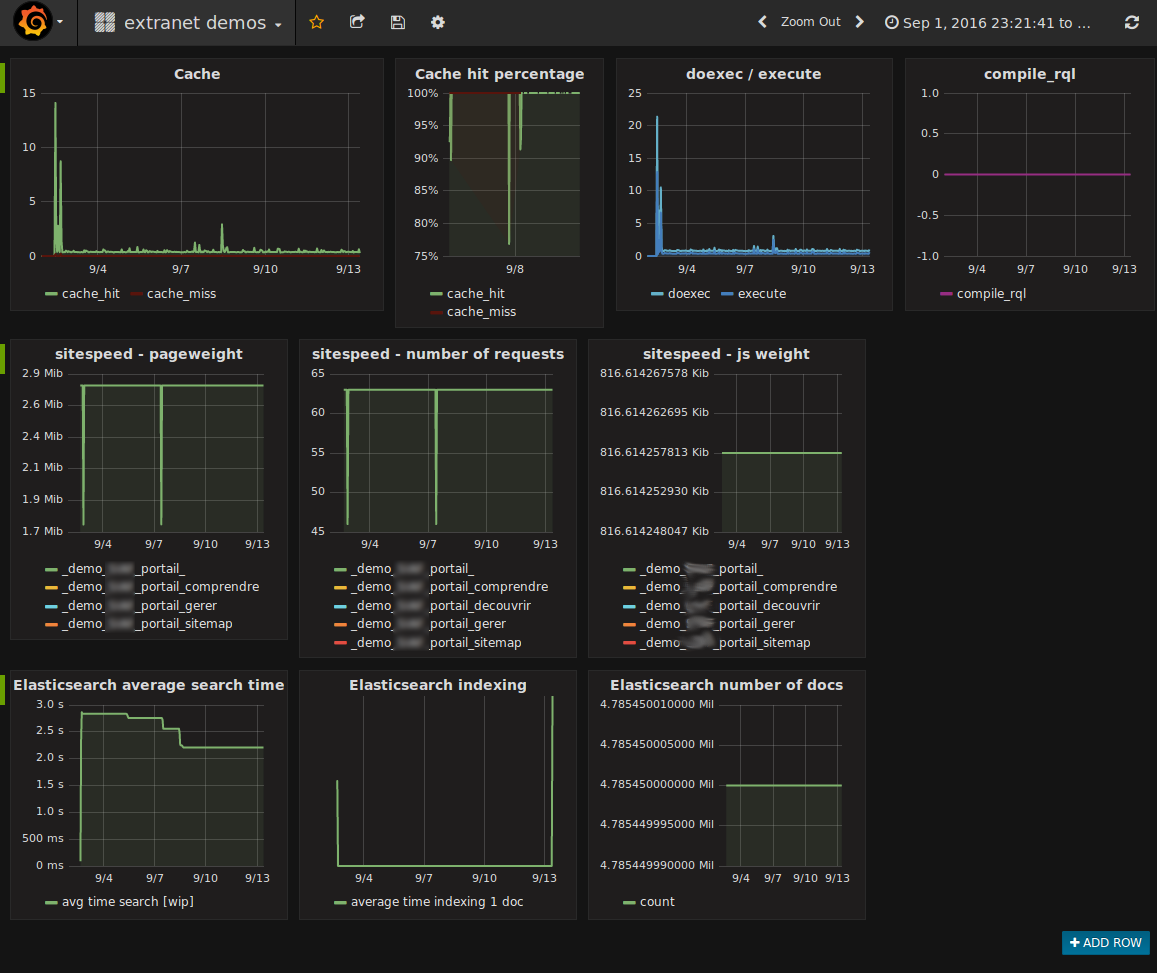
We've spend little time on the dashboard yet since we're concentrating on collecting the metrics for now. But here is a glimpse of the "work in progress" dashboard which combines various data sources and various metrics on the same screen and the same time scale.

Further plans
- internal health checks, we're taking a look at python-hospital and healthz: Stop reverse engineering applications and start monitoring from the inside (Monitorama) (the idea is to distinguish between the app is running and the app is serving it's purpose), and pyramid_health
- graph the number of Sentry errors and the number of types of errors: the sentry API should be able to give us this information. Feed it to Salt and Carbon.
- setup some alerting : next versions of Grafana will be doing that, or with elastalert
- setup "release version X" events in Graphite that are displayed in Grafana, maybe with some manual command or a postcreate command when using docker-compose up ?
- make it easier for devs to have this kind of setup. Using this suite of tools in developement might sometimes be overkill, but can be useful.
